
Understanding Interactive Knowledge Maps
Definition and Core Concepts
Interactive knowledge maps are dynamic visual representations of information that allow users to explore, manipulate, and interact with complex data in an intuitive manner. These digital tools transform abstract concepts and relationships into tangible, navigable structures, making it easier for individuals to grasp and retain intricate information.
The fundamental components of interactive knowledge maps include:
Nodes: Representing individual concepts or data points
Connections: Illustrating relationships between nodes
Layers: Allowing for hierarchical organization of information
Interactivity: Enabling users to zoom, click, drag, and expand elements
Multimedia integration: Incorporating text, images, videos, and links
By leveraging these elements, interactive knowledge maps create a powerful tool for visualizing and understanding complex systems, processes, and ideas across various fields of study and professional applications.
Evolution of Data Visualization
The journey of data visualization has evolved from simple cave paintings to sophisticated interactive digital interfaces. Early forms included maps, charts, and graphs, which emerged in the 17th and 18th centuries. The 19th century saw the birth of statistical graphics, with pioneers like William Playfair introducing bar charts and line graphs.
The digital age expanded the possibilities for data visualization exponentially. The advent of computer graphics in the 1960s and 1970s paved the way for more dynamic representations of data. Today, interactive knowledge maps represent the cutting edge of this evolution, combining traditional visualization techniques with modern computing and artificial intelligence.

Challenges in Processing Complex Information
Information Overload in the Digital Age
In today's digital landscape, we are confronted with an unprecedented deluge of information. The sheer volume of data being generated, shared, and consumed is staggering. This information explosion presents significant challenges for individuals and organizations alike.
Our cognitive abilities have limitations when it comes to processing and retaining large volumes of complex data. The human brain can only hold about 4-7 pieces of information in short-term memory at once. When bombarded with excessive information, we experience cognitive overload, leading to decreased productivity, increased stress, and impaired decision-making.
Traditional Methods vs. Modern Approaches
Traditional methods of handling complex information, such as linear note-taking and static diagrams, are increasingly proving inadequate in the face of today's information challenges. In contrast, modern approaches like interactive knowledge mapping offer a more dynamic and flexible solution.
Interactive knowledge maps support:
Spatial thinking
Non-linear exploration of information
Personalized learning experiences
AI and machine learning assistance
As we continue to navigate the complexities of the information age, the shift towards more dynamic and interactive approaches to knowledge management becomes not just beneficial, but necessary.
Benefits of Interactive Knowledge Mapping
Enhanced Comprehension and Retention
Interactive knowledge maps offer significant advantages for understanding and remembering complex information. The visual nature of these maps taps into our brain's innate ability to process visual information more efficiently than text alone. Studies have shown that the human brain processes visual information 60,000 times faster than text.
By representing ideas and their relationships spatially, interactive knowledge maps create a mental model that's easier for our brains to grasp and retain. This approach aligns with the concept of spatial memory, which is often more robust and long-lasting than rote memorization of facts.
Efficient Information Navigation
One of the most significant advantages of interactive knowledge maps is their ability to facilitate efficient navigation through vast amounts of complex information. This efficiency is achieved through several key features:
Hierarchical organization
Visual cues
Search functionality
Hyperlinks and pop-ups
The ability to navigate information efficiently not only saves time but also promotes a more comprehensive understanding of the subject matter. Users can easily explore connections between different concepts, uncovering relationships that might not be apparent in a linear format.
ResearchFlow's Innovative Mapping Features
AI-powered PDF Transformation
ResearchFlow's AI-powered PDF transformation feature represents a significant leap forward in how we interact with academic literature and complex documents. This innovative tool allows users to convert dense, text-heavy PDFs into interactive knowledge maps with just a single click.
The transformation process involves several steps:
Text extraction and cleaning
Identification of main topics and subtopics
Recognition of relationships between concepts
Extraction of key data points and figures
Generation of a hierarchical structure
Creation of an interactive visual representation

By automating the process of extracting and organizing key information from academic papers, ResearchFlow's AI-powered PDF transformation feature significantly reduces the time and cognitive load required to process complex academic literature.
Multi-document Comparison Capabilities
ResearchFlow's multi-document comparison feature takes the concept of interactive knowledge mapping to the next level by enabling users to visually analyze and compare multiple documents simultaneously. This powerful tool helps researchers, analysts, and students quickly identify similarities, differences, and trends across various sources of information.
Feature | Description | Benefit |
|---|---|---|
Color-coded nodes | Indicate source documents | Easy identification of information sources |
Overlapping areas | Show shared concepts | Quick recognition of common themes |
Side-by-side comparison | Compare specific sections | Detailed analysis of differences |
Filtering options | Focus on themes or time periods | Customized view of relevant information |
Practical Applications Across Industries
Academic Research and Learning
Interactive knowledge maps have revolutionized the landscape of academic research and learning. In academic research, these maps serve as invaluable aids in managing the ever-growing body of literature across various fields. For students, interactive knowledge maps offer a powerful learning tool that aligns with diverse learning styles.
In collaborative research projects, these maps serve as a shared visual language, facilitating communication between team members who may have different areas of expertise. For educators, interactive knowledge maps can be leveraged to create more engaging and effective lesson plans.
Business Intelligence and Decision Making
In the fast-paced world of business, interactive knowledge maps have emerged as a game-changing tool for business intelligence and strategic planning. These dynamic visual representations of complex information are transforming how companies analyze market trends, understand customer behavior, and make informed decisions.
Applications in business include:
Market analysis
Strategic planning
Risk management
Customer insights
Data visualization for finance and technology sectors
As businesses continue to grapple with increasing amounts of data and ever-more complex market dynamics, interactive knowledge maps are becoming an essential tool for turning information into actionable insights.
Implementing Interactive Knowledge Maps
Choosing the Right Tools and Platforms
Selecting the appropriate tools and platforms for interactive knowledge mapping is crucial for successful implementation. When evaluating different tools, consider factors such as ease of use, customization options, collaboration features, integration capabilities, data import/export options, scalability, and mobile accessibility.
For academic institutions or large organizations, it may be worth considering enterprise-level solutions that offer additional features like advanced analytics, custom integrations, and enhanced security measures.
Best Practices for Effective Mapping
Creating effective interactive knowledge maps requires a thoughtful approach to organizing and presenting information. Some best practices include:
Starting with a clear purpose
Keeping it simple at first
Using a logical hierarchy
Leveraging visual elements effectively
Creating meaningful connections
Incorporating multimedia wisely
Regularly reviewing and updating
Collaborating and seeking feedback
By adhering to these best practices, you can create interactive knowledge maps that are not only visually appealing but also highly effective tools for organizing, understanding, and communicating complex information.
Measuring ROI and Long-term Impact
Quantifiable Benefits in Research and Analysis
Measuring the return on investment (ROI) and long-term impact of interactive knowledge mapping in research and analysis is crucial for justifying its adoption and continuous use. Quantifiable benefits include time savings, improved information retention, productivity gains, enhanced quality of work, and more efficient decision-making.
Organizations implementing interactive knowledge mapping tools report an average ROI of 150% within the first year. Long-term impacts include increased successful grant applications, rise in cross-departmental collaborations, improved student satisfaction scores, and increased successful commercialization of research findings.
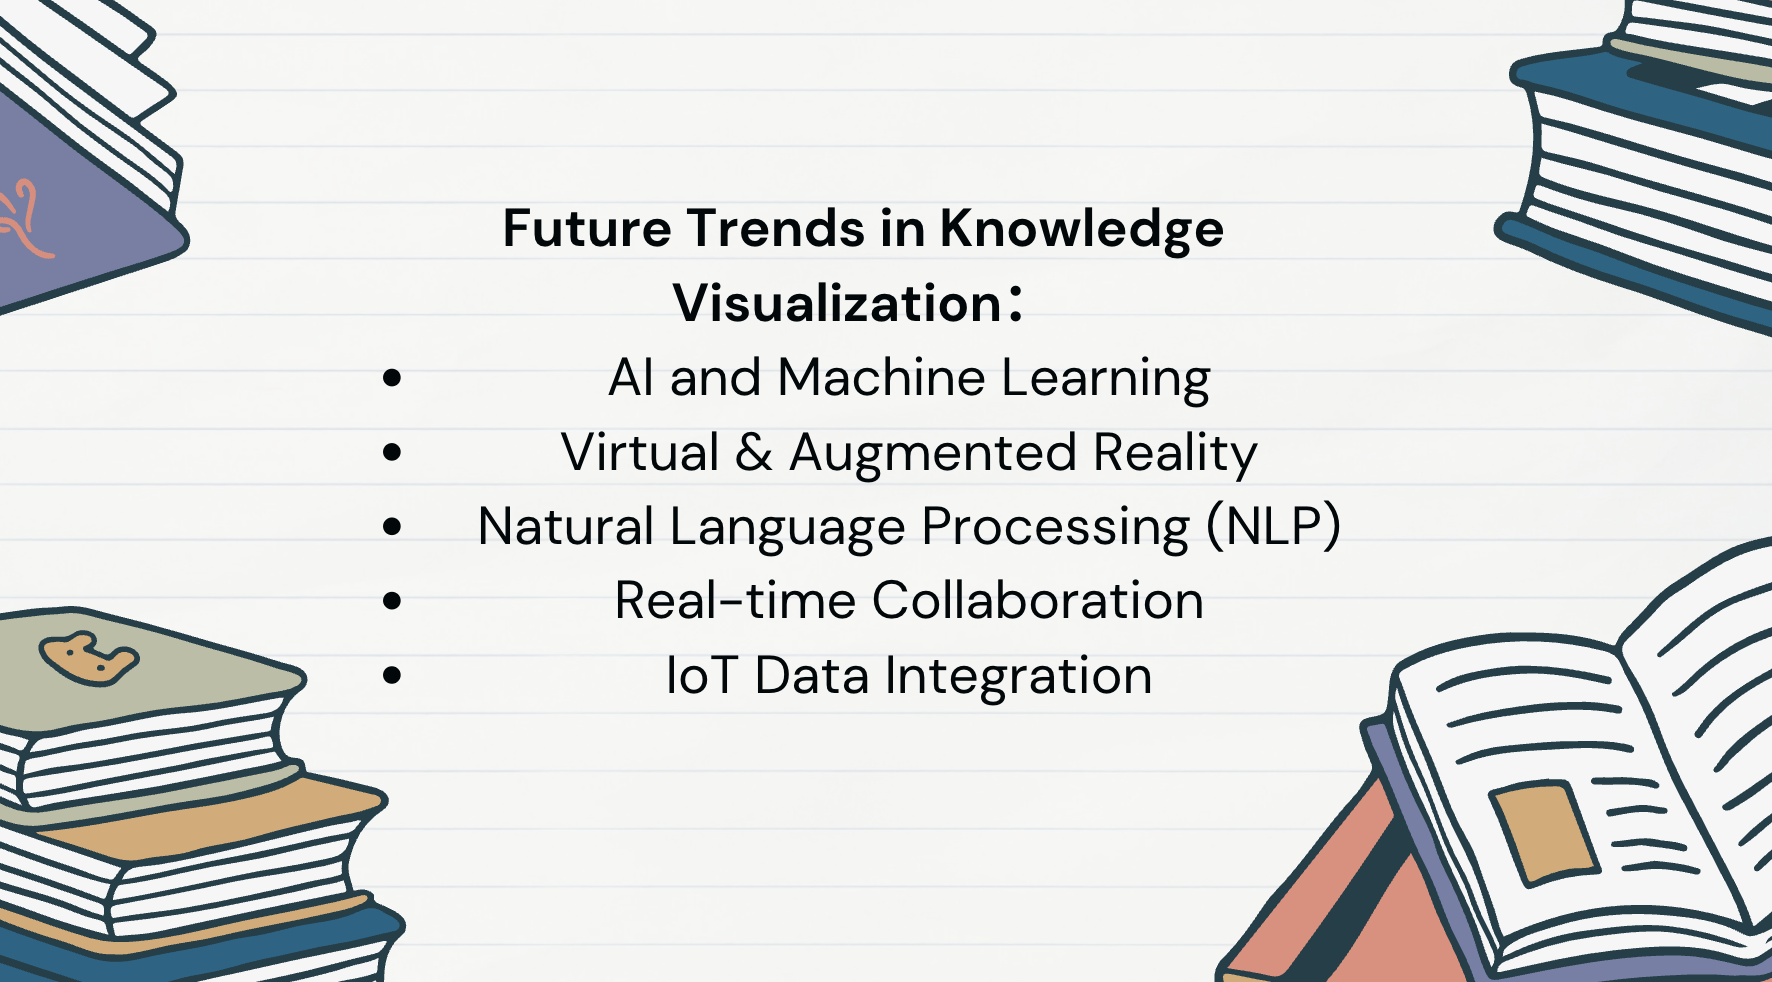
Future Trends in Knowledge Visualization
The field of knowledge visualization is rapidly evolving, driven by advancements in technology and changing needs in information management. Future trends include:
AI and Machine Learning integration
Virtual and Augmented Reality applications
Natural Language Processing advancements
Real-time Collaborative Mapping
Integration with Internet of Things (IoT) data
As these trends continue to develop, we can expect interactive knowledge mapping to become an even more powerful tool for managing and understanding complex information, playing an increasingly crucial role in helping individuals and organizations navigate the complexities of the information age.